


The Consumer Price Index jumped 0.6% in May, after having jumped 0.8% in April, and 0.6% in March – all three the steepest month-to-month jumps since 2009, according to the Bureau of Labor Statistics today. For the three months combined, CPI has jumped by 2.0%, or by an “annualized” pace of 8.1%. This current three-month pace of inflation as measured by CPI has nothing to do with the now infamous “Base Effect,” which I discussed in early April in preparation for these crazy times; the Base Effect applies only to year-over-year comparisons.
On a year-over-year basis, including the Base Effect, but also including the low readings last fall which reduce the 12-month rate, CPI rose 5.0%, the largest year-over year increase since 2008.
In terms of the politically incorrect way of calling consumer price inflation: The purchasing power of the consumer dollar – everything denominated in dollars for consumers, including their labor – has dropped by 0.8% in May, according to the BLS, and by 2.4% over the past three months, the biggest three-month plunge in purchasing power since 1982:
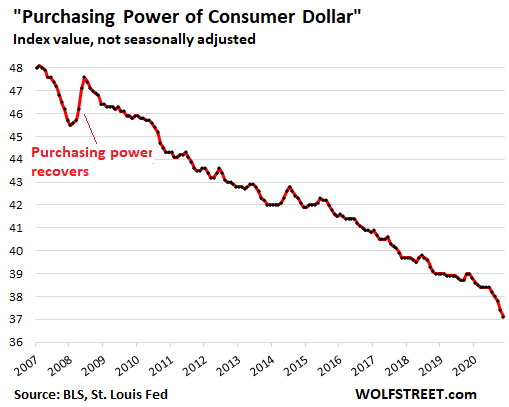
On an annualized basis, the three-month drop in purchasing power amounted to a drop of 9.5%, and this eliminates the Base Effect which only applies to year-over-year comparisons.
That plunge in purchasing power is “permanent” not “temporary.”
Yup, the current plunge in purchasing power is permanent. And the plunge in purchasing power in the future is also permanent.
The only thing that might make a small portion of it “temporary” is if there is a period of consumer price deflation, which has happened for only a few quarters in my entire life, for example in the last few months of 2008, which is indicated in the chart above. So I’m not getting my hopes up.
The rest of the time, we’ve had lots of decline in purchasing power. And that has proven to be rock-solid “permanent,” and we never got that lost purchasing power back.
Durable Goods inflation exploded by 10.3% from a year ago.
And it jumped by 3.0% in May from April, the biggest month-to-month jump since 1980. The problem is across the board, but the biggest biggie is used vehicles.
Used Vehicle CPI exploded by nearly 30% year-over-year, and by 7.3% just in May. I have long been fuming about and dissecting the reasons behind this price surge, based on data from the auto industry. And it is now seriously showing up in used-vehicle CPI.
This chart shows the actual CPI as a price index, not the year-over-year percentage change of that index. This eliminates the issue of the Base Effect.
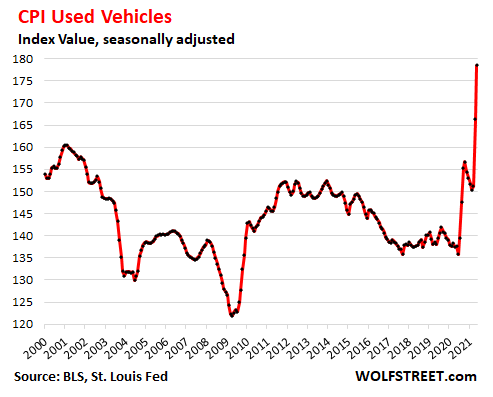
But “hedonic quality adjustments” over the years have held down the CPI for used vehicles, producing this astonishing chart above, where the index in 2020 was below where it had been 20 years earlier, even as in the real world, used vehicles got a lot more expensive. Only the scary-crazy price spikes in May and April pushed the index above its level 20 years ago.
These hedonic quality adjustments are applied to account for improvements in vehicles over the years, such going from a three-speed automatic transmission to a 10-speed electronically controlled transmission. The price increases theoretically associated with “quality improvements” are removed from the CPI.
In theory, CPI attempts to measure price changes of the same item over time; and when the price change is based on improvements, it is not inflation because you’re getting more as you pay more.
In practice, this has led to a consistent, purposeful, politically convenient, and bipartisan understatement of inflation as measured by CPI.
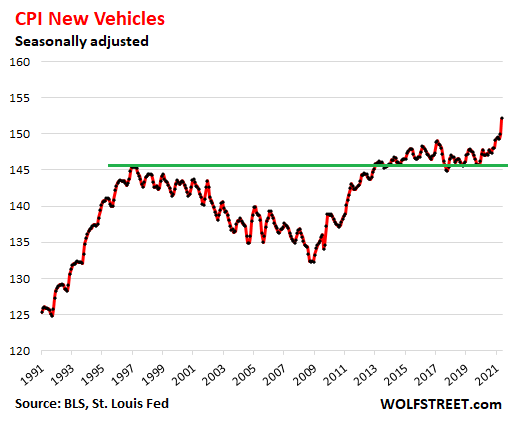
New Vehicle CPI repressed by hedonic quality adjustments. The adjustments have practically eliminated the appearance of inflation as measured by CPI in new vehicles, even though new vehicles have gotten a lot more expensive, with the cheapest cars disappearing from the automakers’ lineups.
Nevertheless, year-over-year new vehicle prices rose 3.3%, the biggest increase since 2012, despite vigorous hedonic quality adjustments. Note how the index used to rise into the mid-1990s, at which point the hedonic quality adjustments were applied and forced the index back down:
For a dose of reality, data from the auto industry shows that the “average transaction price” (ATP) of new vehicles sold to retail customers in May jumped to $38,255. The ATP is a function of the price of new vehicles sold and of the mix of new vehicles sold. Based on data provided by J.D. Power, the ATP has jumped by 28% over the past seven years since 2014. Note the huge jump since June 2020:
![]()
Services CPI jumped 3.1% year-over-year, held down by fake homeownership cost index.
About two-thirds of the overall CPI is for services. They include the biggest biggie of all: housing – more on that in a moment. They also include healthcare, insurance, education, subscriptions for services such as broadband, cellphone, streaming, etc.
The CPI for services rose by 3.1% year-over-year and jumped by 0.5% in May. Over the past three months, the CPI for services rose 1.3%, for an annualized increase of 5.2%.
The actual plunge in purchasing power is even worse.
Housing costs – rent and homeownership costs combined – account for about one-third of overall CPI – it’s the biggest category in CPI.
The rent component of CPI, called “rent of primary residence” (=7.7% of total CPI in May) has been rising month after month this year at a constant 0.2%, including in May, and is up 2.2% over the 12-month period.
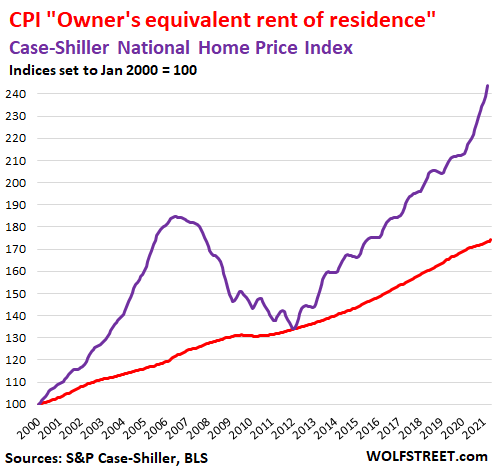
The homeownership component, called “Owners’ equivalent rent of residences” (=23.8% of overall CPI in May), ticked up just 0.3% for the month and a mind-bendingly low 2.1% for the 12-month period, despite the explosion of home prices over the past 12 months.
The reason this homeownership component completely misses the red-hot inflation in housing – the loss of the dollar’s purchasing power with regards to homes – is that it’s based on surveys of homeowners’ estimates of how much their home would rent for. It is a measure of rent, as guessed by the homeowner (red line in the chart below).
The Case-Shiller Home Price Index is a more realistic house-price inflation measure. It’s based on the sales-pairs method, measuring the price changes over time for the same house, soared by 13.2% year-over year, the red-hottest increase since December 2005 (purple line):
The loss of purchasing power is “permanent.”
So, hedonic quality adjustments for durable goods, such as new and used vehicles, plus the elegant fiction of “Owners’ equivalent rent of residences” for housing costs, plus some other CPI reduction methods, such as “substitution,” see to it that the actual loss of purchasing power of the consumer dollar – and of labor that is paid in dollars – is far worse than even these very ugly inflation data released today.
And this loss of purchasing power is permanent. It won’t suddenly come back, except fractionally during these minor bouts of deflation we get every now and then.
What’s “temporary” is the pace of the loss of purchasing power, in the sense that it changes every month.
For sure, the spike in used vehicle prices cannot go on infinitely. At some point it will have to back off. But then other prices will spike, such as airline tickets, hotel bookings, restaurant meals, or insurance.
Inflation is a game of whack-a-mole. One pops up as another backs off. So it could very well be that CPI inflation may be 4% next May, down from 5% now, and we’ll be celebrating that the 5% was “temporary,” and was replaced by 4%, hahahaha. But the purchasing power of the dollar that is lost every month is lost permanently.
Enjoy reading WOLF STREET and want to support it? Using ad blockers – I totally get why – but want to support the site? You can donate. I appreciate it immensely. Click on the beer and iced-tea mug to find out how:

Would you like to be notified via email when WOLF STREET publishes a new article? Sign up here.


