


Panic buying in late February and March was followed by a sudden shift in consumption in mid-March away from restaurants, schools, college campuses, office buildings, other work locations to supermarkets, warehouse clubs, and ecommerce. For weeks, brick-and-mortar retail supply chains failed to keep up, and bare shelves in some product categories became a common sight. But the supply chains at the other end of the spectrum ground to a halt, stuck with goods that had no place to go.
This divergence has shown up in the trucking business. March was busy for truckers hauling dry-van trailers and refrigerated trailers (reefers). The Van Load-to-Truck ratio in the spot market surged by 56% from February and by 84% from March last year, according to DAT Trendlines. The Reefer Load-to-Truck ratio surged by 45% from February and by 91% from March last year.
But in April so far, all this has unwound. In the week ending April 12, the Van Load-to-Truck ratio plunged 44% from a week earlier. For the past two weeks, “Van spot freight volumes lost 20%,” DAT reported, “and national average rates lost 8¢ per mile, to $1.78, reflecting declines all over the country.”
“Reefer trends weren’t much better,” DAT said. The Reefer Load-to-Truck ratio plunged 42% over the week ended April 12, compared to a week earlier. “It’s been an up-and-down kind of market for reefer equipment,” DAT said in a blog post on April 9. “We’re not talking about a gentle rise and fall – more like a giant roller coaster.”
But it’s a very dynamic market, with reefers getting switched from the shut-down food services industry (such as restaurants and schools), to haul produce for the grocery supply chain:
Luckily for reefer carriers, there are still some markets and lanes where spot rates are rising. That’s because more fresh produce is coming into season, just as other refrigerated foods are being re-supplied to grocery stores at a more normal cadence. Produce season bolsters rates to some degree, but rates also face downward pressures because of the sharp decline in food services.
Trucking companies that used to service fast-food chains and school cafeterias are more temp-controlled trucks available to move whatever needs moving, so capacity is expanding while the level of demand is not going to change all that much. Everyone is still eating, even though the dining table is at home instead of in a restaurant.
The Flatbed Load-to-Truck ratio — it reflects demand for hauling equipment and supplies for industrial, construction, and oil-and-gas-drilling sectors — had been weak all last year. In March, it was down 10% from a year ago. In the week ended April 12, it plunged 43% from the prior week.
That week was further complicated for truckers by the havoc tornadoes wreaked in South Central and Southeast regions with high winds and heavy rain sweeping up the East Coast.
Based on its Market Conditions map, DAT said: “There are exactly two hot spots in the U.S. for carriers: Houston and Laredo. If you’re in South Texas, you should be able to find a load, and possibly a decent rate. A handful of markets are lukewarm, neutral, or cool, but most are an icy cold, deep blue.”
In broader terms…
Shipment volume in the US by truck, rail, air, and barge plunged 9.2% in March compared to the already weak March last year, and is down 10.1% from March 2018, according to the Cass Freight Index for Shipments. It was the 16th month in a row of year-over-year declines. The January and March declines were the steepest since October 2009. The declines accelerated last December:
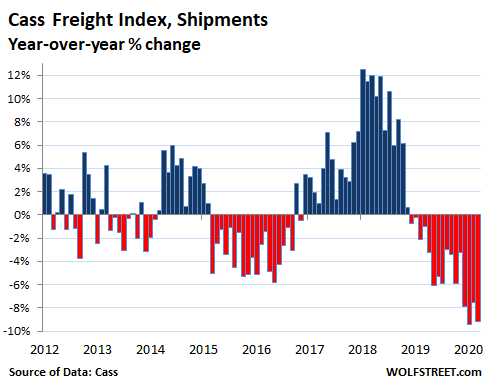
The Cass Freight Index tracks the shipment volume of consumer goods and industrial products and supplies by all modes of transportation – truck, rail, air, and barge – but is more focused on trucking. It does not track bulk commodities, such as grains or coal.
“This has quickly gone from a China production concern to a US (and global) consumer spending problem,” said the Cass report. And it added, “April will undoubtedly be worse and likely the worst month in a long time.”
“There has been a clear divide between winners and losers of these shut-in orders,” Cass said. Ecommerce demand surged; consumers shifted purchases of supermarket goods to online for safety reasons; and consumers shifted other purchases online because the brick-and-mortar stores were shut down.
At the brick-and-mortar level, demand in March increased for groceries, home improvement goods, and consumer staples; but restaurant, auto, and mall-retail fell “to practically zero volume.”
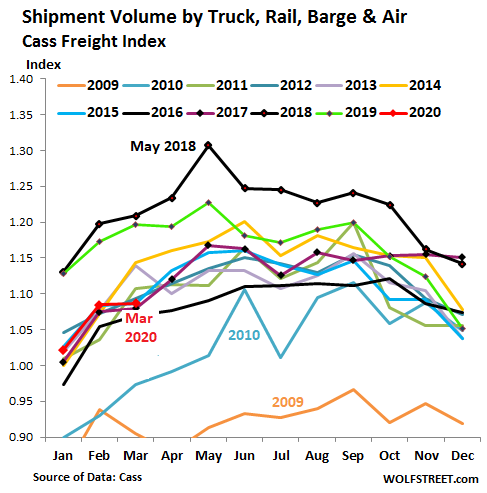
The stacked chart – a line for each year going back to 2009 – shows the seasonality of the freight business. The top black line represents the historic shipping boom of 2018, when companies were trying to front-run the potential tariffs. 2019 (green) deteriorated as the year progressed. The red line represents 2020. The index for March was below March 2011, 2012, 2013, 2014, 2018, 2019. Also note Financial Crisis years 2009 (brown) and 2010 (light blue) at the bottom:
Railroads…
In March, rail carloads – various commodities, steel products, chemicals, autos, and others – fell 6% year-over-year, the Association of American Railroads reported. Containers and trailers (“intermodal”) fell 12.2%.
And this turned for the worse going into April. According to the AAR, for the week ended April 4, the latest available, intermodal units dropped 15.7% year-over-year. And car loads dropped 16.2%. Coal has been declining sharply for years. But even without coal, carloads declined by 13.1%. “We haven’t seen sustained declines of that magnitude since the Great Recession,” the report said.
Railroads have been reporting weak figures since last year, long before the coronavirus was an issue. For the first 14 weeks of this year, carloads fell 7.1% year-over-year, and intermodal units fell 9.1%.
In terms of intermodal units, the AAR said that this business much will depend on American consumers and their spending patterns. And “that, in turn, will depend on how long social distancing steps must remain in place; how well and how quickly federal and state unemployment insurance and other programs fill gaps in household cash flows; and how much the current situation causes consumers to lose long-term confidence and remain in retrench mode not just when health concerns begin to recede but, more importantly, when they have been largely resolved.”
In terms of carloads, the biggest declines were in steel scrap, steel products, nonferrous scrap, crushed stone, and – due largely to the oil-and-gas bust – sand, such as frac sand, and petroleum products. But the worst hit were autos and auto parts; with auto manufacturing shut down, carloads in that category plunged by 84%.
The numbers are huge: SoftBank Group said it would book a loss of $16.7 billion at its Vision Fund, stemming “from a decrease in the fair value of investments due to the deteriorating market environment.” But those paper gains sure were fun while they lasted. Read... SoftBank’s Fake Startup “Valuations” Come Unglued
Enjoy reading WOLF STREET and want to support it? Using ad blockers – I totally get why – but want to support the site? You can donate. I appreciate it immensely. Click on the beer and iced-tea mug to find out how:

Would you like to be notified via email when WOLF STREET publishes a new article? Sign up here.


